Enter your email address
Submit


![]()
![]()
![]()
✅ It was revealed that mental load was high in assembly lines of the manufacturing industry and this result was also confirmed by physical evaluation. This study indicated that overall score of SMWL can affect the incidence of MSDs. That is why mental workload should be considered as a risk factor for MSDs.
Repeatedly performing a particular activity or performing in an inappropriate physical condition may cause musculoskeletal disorders [5]. The Occupational Repetitive Actions Index (OCRA) can be used to assess the risk factors associated with work-related musculoskeletal disorders (MSCs). This method has been suggested for analyzing the risk factors of repetitive upper limb movements [10].
Mental workload can be defined as the amount of mental effort that a person makes while performing a task, given his or her mental capacity to receive information, process and make decisions [14]. There are several methods of assessing subjective load, the NASA-TLX (National Aeronautics and Space Administration-Task Load Index) tool is one of these self-report tools related to cognitive tasks.
This study aims to investigate the subjective workload and prevalence of musculoskeletal disorders in female assembly workers and, based on the results, provide measures to control workload and ultimately c.
This study is a cross-sectional study that was conducted on a simple random sampling method on 120 female assembly workers of a Chinese plates manufacturing industry. Subjects were selected according to inclusion criteria (having at least one year of work experience, no history of hand surgery, no osteoporosis, no fractures or abnormalities in the hands, no pregnancy and no diabetes). In the second stage, demographic data were collected and the variables studied, including the question whether they were right or left handed. The prevalence of musculoskeletal disorders was assessed using Nordic wrist and hand questionnaires and interviews with individuals. It is worth mentioning that the reliability and validity of this questionnaire has been confirmed in Persian by various studies [33, 2]. Thereafter, the NASA-TLX questionnaire (NASA-TLX Index is a powerful tool for assessing subjective workload [26], whose reliability and validity were confirmed by Cronbach's alpha coefficient of 0.83 by Seraji et al. [28]) were filled and information was received from individuals at the end of the shift. OCRA musculoskeletal load assessment was also performed during the worst posture, information on OCRA factors was collected in a checklist and then evaluated in ErgoIntelligence -UEAsoftware. Data analysis was done using SPSS 20 (SPSS Inc., Chicago, IL., USA), independent t-test, paired t-test, Spearman correlation coefficient, Wilcoxon and Mann-Whitney test and P-value <0.05 was considered significant.
The mean and standard deviation of age and work experience of participants were 33.16±6.80 years and 7.06±5.35 years, respectively. Descriptive statistics of qualitative variables and demographic data of the subjects are presented in Table 1.
Table 1. Descriptive statistics of the qualitative variables of the subjects
| % | N | Grouping | Qualitative variables | |
| 15.0 | 18 | Single | marital status |
|
| 85.0 | 102 | Married | ||
| 12.5 | 15 | Yes | sports program |
|
| 87.5 | 105 | No | ||
| 88.3 | 106 | Right | The dominant hand |
|
| 11.7 | 14 | Left | ||
| 73.3 | 88 | High school diploma | Education | |
| 10.8 | 13 | College degree | ||
| 15.0 | 18 | Bachelor’s degree | ||
| 0.8 | 1 | Master |
The results of the Nordic questionnaire are presented in Figure 1.

Figure 1. Percentage of pain intensity experienced in workers with ankle pain
Table 2. Duration and consequences of wrist and hand problems
| People with trouble experience at hand | Grouping | % |
| Duration of wrist and hand discomfort over the past 12 months |
Zero days | 0 |
| 1 to 7 days | 25.8 | |
| 8 to 30 days | 22.5 | |
| More than 30 days but not every day | 12.5 | |
| everyday | 2.5 | |
| Percentage of decline in job activity over the past 12 months due to wrist and hand discomfort | - | 53.3 |
| Percentage decline in daily recreation over the past 12 months due to wrist and hand discomfort | - | 31.7 |
| Duration of daily activities due to wrist and hand discomfort over the past 12 months |
Zero days | 0.8 |
| 1 to 7 days | 36.7 | |
| 8 to 30 days | 23.3 | |
| More than 30 days | 2.5 | |
| Percentage of referrals to a doctor in the past 12 months due to wrist and hand discomfort | - | 21.7 |
The results of physical evaluation of OCRA workload are presented in Table 3.
Table 3. Percentage of OCRA Risk Levels in Right and Left Hand and Comparison in Both Hands of Assembler Women
| Wilcoxon test | Left hand (N=120) |
Right hand (N=120) |
Grouping | Level of risk |
| P=0.001 | 35.0% | 2.5% | Green | |
| 30.8% | 24.2% | Green-yellow | ||
| 25.8% | 40.0% | Yellow | ||
| 8.3% | 33.3% | Red | ||
| Paired-t-test | Left hand (N=120) |
Right hand (N=120) |
Statistical indicators | OCRA index |
| P=0.001 | 1.92 | 3.92 | Average | |
| 1.45 | 2.92 | Standard deviation | ||
| 0.48 | 0.65 | Minimum value | ||
| 7.41 | 15.43 | The maximum amount |
The correlation between OCRA and wrist pain is also shown in Figure 2.
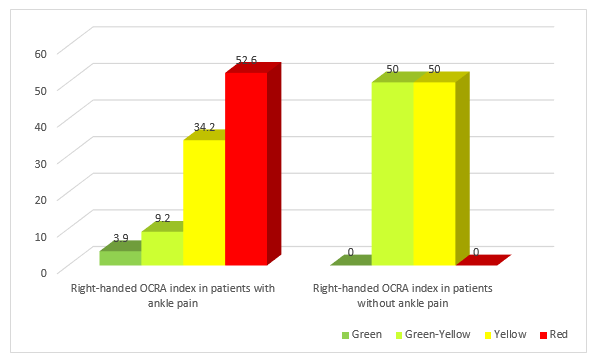
Figure 2. Relationship between OCRA risk levels and wrist pain
Table 4. Results of the NASA TLX questionnaire on assembly women
| NASA TLX variables | M | SD | Minimum value | Maximum value |
| Intellectual and mental burden | 63.17 | 22.398 | 5 | 100 |
| Physical load | 78.79 | 19.562 | 5 | 100 |
| Performance and Performance | 40.25 | 19.304 | 5 | 95 |
| Time pressure | 74.54 | 19.370 | 20 | 100 |
| Attempt and effort | 78.37 | 20.002 | 20 | 100 |
| Feeling discouraged and frustrated | 64.08 | 25.421 | 5 | 100 |
| Total mental load | 69.78 | 12.32 | 36.67 | 95 |
Table 5 presents the correlations of the mean of six subscales of mental workload and wrist pain.
Table 5. Relationship between the mean of the six sub-scales of the NASA TLX Index and wrist pain in female assembly workers
| NASA TLX variables |
Total )N=120) | With wrist pain )N=76) | Without wrist pain )N=44) | P-Value |
| Mean±SD | ||||
| Intellectual and mental burden | 63.17±22.3 | 24.8±62.83 | 17.72 ±63.75 | P= 0.83 |
| Physical load | 19.2±78.79 | 18.5±81.05 | 20.04±74.89 | P= 0.045 |
| Performance and Performance | 19.3±40.25 | 18.5±35.92 | 18.37±47.73 | P= 0.001 |
| Time pressure | 19.3±74.54 | 20.6±74.93 | 17.18±73.86 | P= 0.77 |
| attempt and effort | 20±78.38 | 18.4±80.72 | 22.06±74.32 | P= 0.046 |
| Feeling discouraged and frustrated | 25.4±64.08 | 26.4±65.66 | 23.51±61.36 | P = 0.37 |
| Total mental load | 12.3±69.78 | 13±71.54 | 10.50±66.74 | P = 0.039 |
Spearman correlation coefficient showed that there was a direct relationship between wrist pain intensity and OCRA risk index (P= 0.001) and total NASA score (r = 0.223, P<0.05).
Conclusion
In general, the results of the present study showed that the workload was physically and psychologically increased in the assembly lines, followed by the wrist disorders. This study showed that overall mental workload score can influence the incidence of MSDs. Understanding the risk factors involved in the development of MSDs, especially psychological factors, is an important issue. Since MSDs have become an important health issue for industries and communities today, the results of these risk factors can be of great help to industrial health professionals in providing preventive and control strategies. One of these risk factors seems to be mental workload scales. For this reason, mental workload should be assessed and considered as a risk factor for MSDs.
This research is part of an approved research plan with the number 396350 and code of ethics IR.MUI.REC.1396.3.350. The authors are grateful for the cooperation of the university and all participants.
The authors declared no conflict of interest regarding the publication of this article.
| Rights and permissions | |
 |
This work is licensed under a Creative Commons Attribution-NonCommercial 4.0 International License. |